 Follow Official WeChat
Distributed Optical Fiber Sensing in Concrete Beam Load Testing
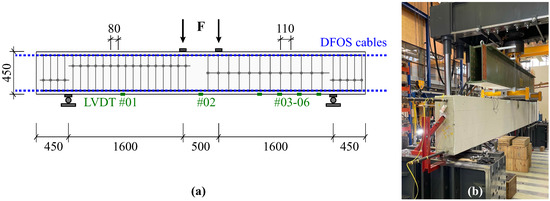
For example, Figure 1 shows a schematic of an instrumented beam structure with a total length of 4.6 meters and its corresponding setup on the test facility. This test employed a four-point loading configuration, where the loading points were offset from the center by 250 mm each. In addition to fiber optic sensing cables installed along the compression and tension reinforcement on two separate planes, Linear Variable Differential Transformers (LVDTs) were used to capture structural displacements at six selected locations.
Assessment of Different Sensor Installation Techniques
More Blog Videos
What is a DAS Distributed Acoustic Sensing System? Principles and Application Analysis
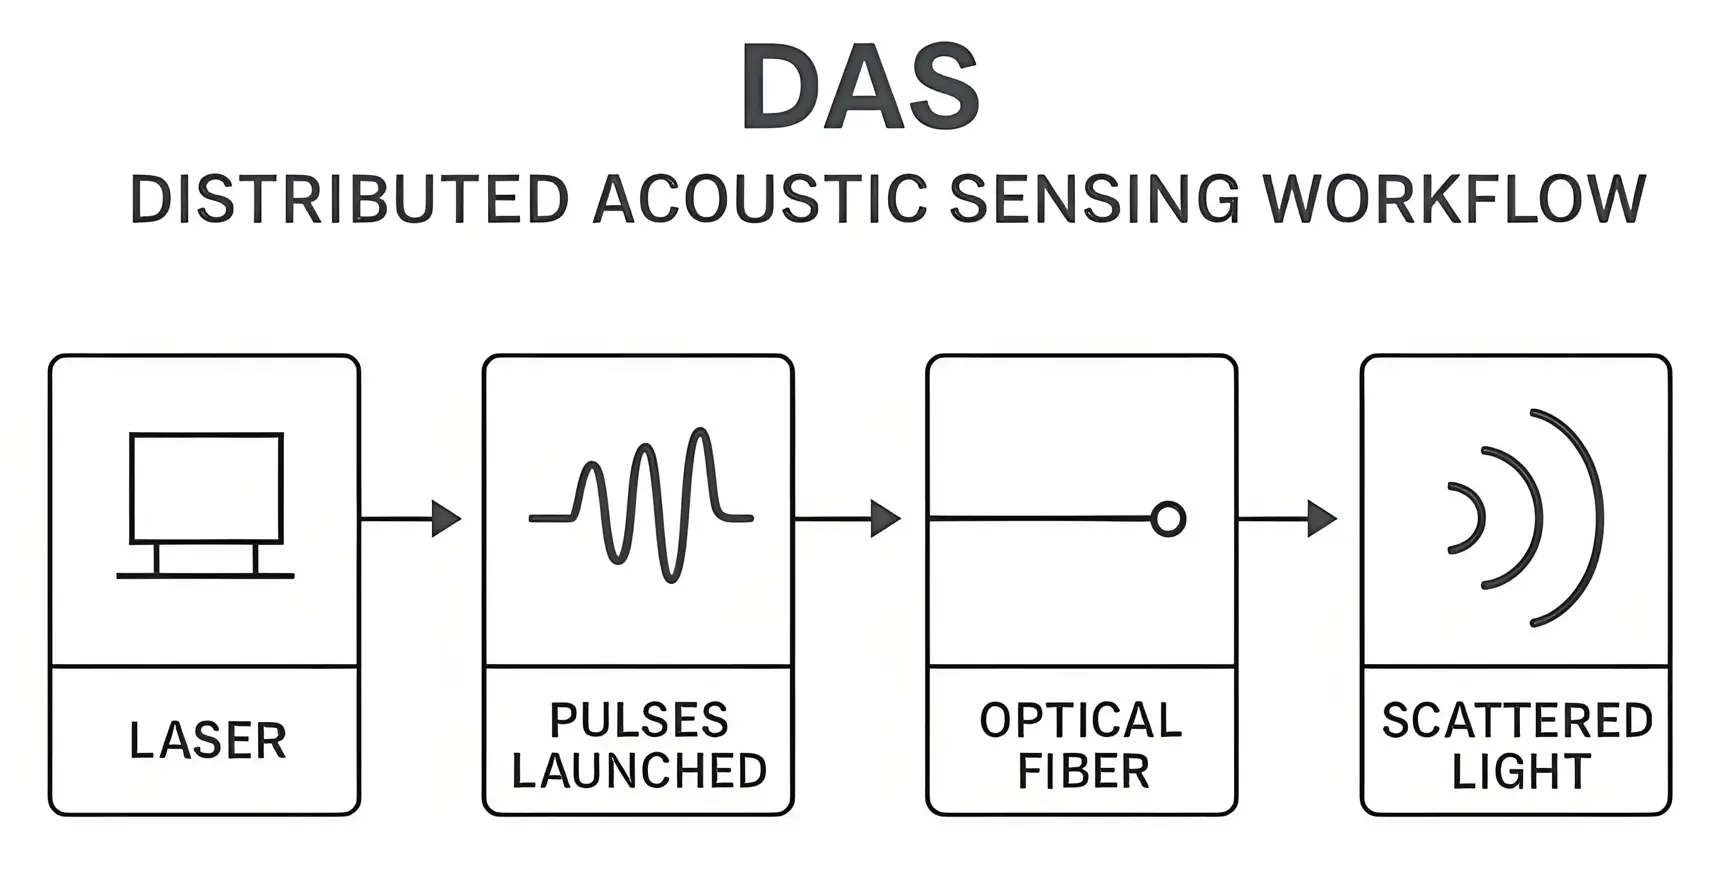
In the field of optical fiber sensing technology, the DAS (Distributed Acoustic Sensing) system has emerged as a pivotal technology with rapid development in recent years. By utilizing the optical fiber itself as the sensing element, a DAS system enables continuous, real-time, and long-distance monitoring of vibration and acoustic signals along the fiber. This capability has led to its widespread application in fields such as oil pipeline monitoring, railway safety monitoring, perimeter security, and seismic monitoring.
Release Date: 2026-03-13
OFDR vs. OTDR: What's the Difference? A Comprehensive Comparison of Principles and Applications
In the fields of optical fiber testing and fiber optic sensing, OTDR (Optical Time Domain Reflectometer) and OFDR (Optical Frequency Domain Reflectometer) are two critically important measurement technologies.
Release Date: 2026-03-09
Core Technologies and Selection Guide for High-Speed Data Acquisition Cards
With the advancement of optoelectronic measurement techniques, Distributed Acoustic Sensing (DAS), radar signal processing, and scientific experimental equipment, the High-Speed Data Acquisition Card (DAQ) has become a core component in many high-end instrumentation systems. The performance of the data acquisition card directly dictates the system's signal acquisition capability, measurement precision, and real-time processing power.
Release Date: 2026-03-04
Engineering Methods for Enhancing DAS Signal-to-Noise Ratio (SNR)
Engineering Optimization Practices for Distributed Acoustic Sensing (DAS) Systems In a Distributed Acoustic Sensing (DAS) system, the Signal-to-Noise Ratio (SNR) directly dictates the achievable sensing distance, spatial resolution, capability to detect weak vibrations, false positive and false negative rates, and the efficacy of post-processing algorithms. Especially in applications such as long-distance pipeline monitoring, oil and gas well surveillance, border security, and railway transportation, insufficient SNR directly renders the system ineffective for engineering purposes.
Release Date: 2026-02-28

Engineering Practice of DAS in Utility Tunnel Vibration Monitoring
As the scale of urban underground utility tunnels continues to expand, achieving 24/7 online monitoring of structural integrity, external construction disturbances, and unauthorized intrusion has emerged as a critical challenge in the development of smart cities.
Release Date: 2026-02-25
Comparison of DAS and FBG Vibration Monitoring Technologies
With the widespread adoption of fiber optic sensing technology in fields such as rail transit, pipeline security, perimeter intrusion detection, and structural health monitoring, Distributed Acoustic Sensing (DAS) and Fiber Bragg Grating (FBG) based vibration monitoring have emerged as the two most frequently compared solutions by end-users.
Release Date: 2026-02-14